
The problem with creating diagrams
Manually creating a flowchart can eat up a lot of time, even when you have a clear plan. You start by placing boxes, drawing connecting arrows, and labeling each step. Adjusting spacing, fixing misaligned connectors, and resizing shapes sends you back into formatting mode. With each small tweak—moving a box, redrawing an arrow, or editing text—you lose your train of thought. By the time the diagram looks right, you’ve spent more time wrestling with layout than refining your ideas.
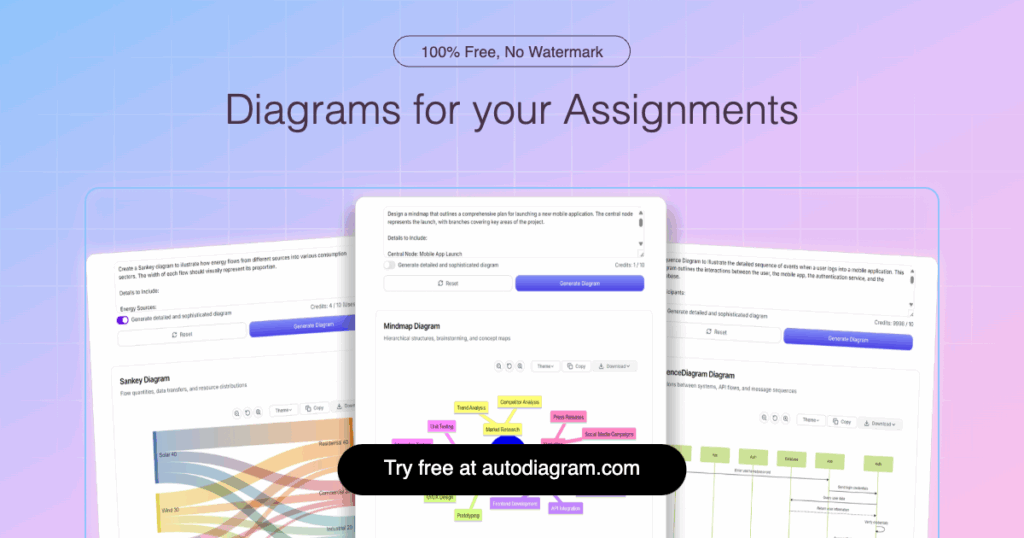
Solution: AutoDiagram
AutoDiagram is an AI-powered tool designed to instantly convert code or textual descriptions into clear, professional diagrams. Its primary function is to simplify and automate the process of creating a wide variety of diagrams
How to access: https://www.autodiagram.com/
AutoDiagram can help you:
- Instant generation: Generate diagrams instantly from code or plain-text descriptions.
- Extensive support: Supports over 20 diagram types, from sequence and class diagrams to ER charts and mind maps.
- Multiple formats: Export in SVG, PNG, or PDF for seamless sharing.
Example:
Imagine you are a product manager at a fintech startup building a secure website. Before the sprint, you need a clear flowchart of the OAuth2 authentication flow covering user login, credential validation, MFA, JWT issuance, and resource access. With AutoDiagram, simply paste your prompt description and let it generate the diagram.
Prompt:
Create a flowchart illustrating the OAuth2 authentication flow for a web application:
- User submits login form (username & password)
- Front-end sends credentials to Auth Server
- Auth Server validates credentials
└─ If invalid, return “Login Failed” and end - Auth Server triggers MFA (SMS or email OTP)
- User enters OTP
- MFA Service verifies OTP
└─ If invalid, return “MFA Failed” and end - Auth Server issues JWT access token
- Front-end stores JWT and includes it in API requests
- API Gateway receives request and validates JWT signature
└─ If invalid/expired, return “401 Unauthorized” - Gateway routes valid request to Resource Server
- Resource Server returns protected data
Use:
- Rectangles for steps
- Diamonds for decision points
- Solid arrows for synchronous calls, dashed arrows for asynchronous events
- Blue nodes for user actions, gray nodes for system processes
- Minimalist style suitable for a technical spec document
What makes AutoDiagram special?
- No drawing: No manual drawing—diagrams in seconds.
- Context-aware: AI suggests the best layout and diagram type.
- Free start: Begin without a credit card; scale as needed
Note: The tools and analysis featured in this section demonstrated clear value based on our internal testing. Our recommendations are entirely independent and not influenced by the tool creators.

![[Episode 19]](https://aiandbeyond.ai/insights/wp-content/uploads/2025/01/Episode-19-400x225.png)